What am I Looking At?
Institutional knowledge is difficult to document. You know something, and don’t think to write it down anywhere. So, what happens when the one person who installed the city cameras—the guy who knows what resources is where, and how it works—decides to retire? If you’re lucky, there is an organizational system in place to ensure a seamless transition, but more often than not, it’s a scramble for someone new to learn the system all over again. And if an agency has truly planned for growth and change, they’ve installed a DETECT VMS.
Map View
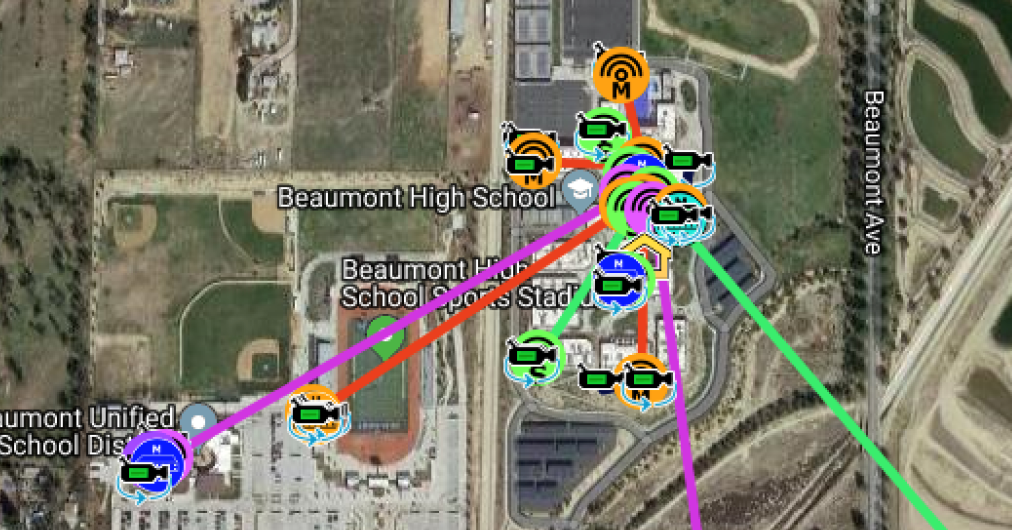
The most obvious—and in many ways, the most useful—feature of DETECT VMS is Map View. The software launches to a map interface, generally based on Google Maps, with an overlay of every asset in the system displayed graphically. A quick glance can show where cameras are positioned, and whether the cameras are working.
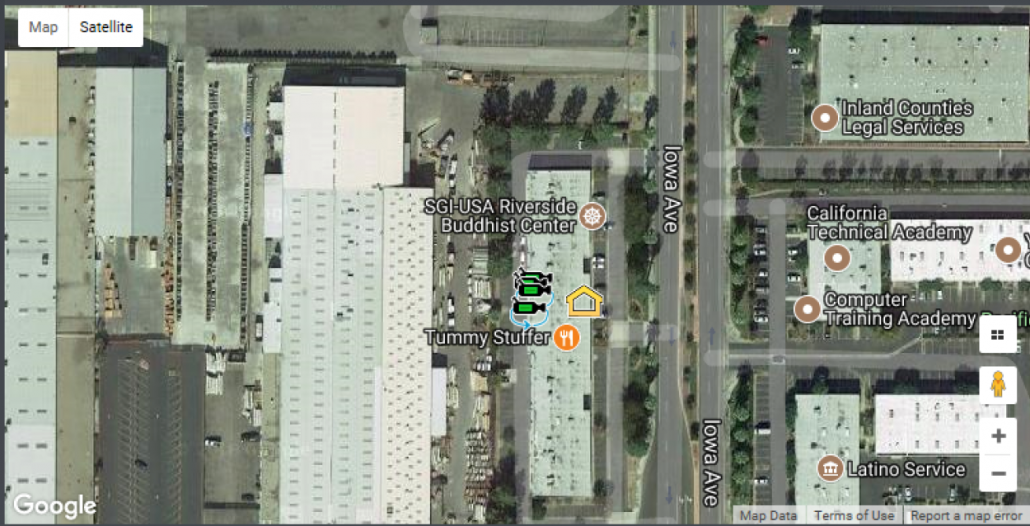
Icons are overlaid directly on a map interface. A green icon indicates that the camera is communicating with the system, while a red icon shows a camera that is offline for some reason.
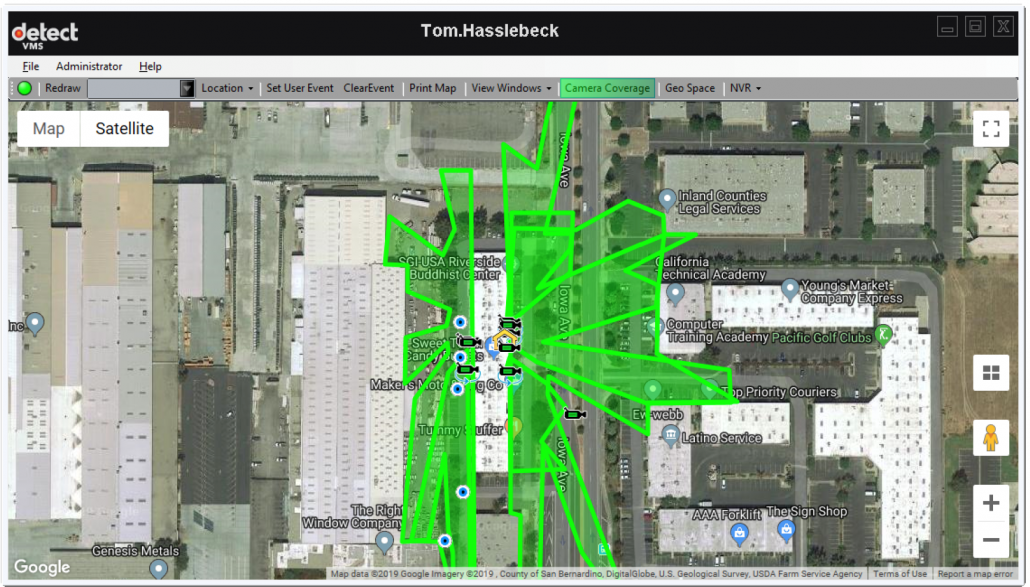
When the system is completely configured, geometric overlays indicate camera coverage’s – the geographic area that a camera can reasonably expect to capture. Toggling that layer on gives a comprehensive view of the coverage of all the cameras in the system.
Quick-access camera controls
Directly from Map View, a user can select a camera icon to perform a number of tasks.
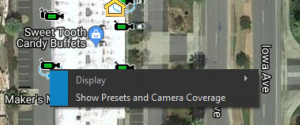
A single click can show the preset views associated with a particular PTZ camera, or highlight the coverage area of just that single camera. Another click will display the live camera video feed in a Display View window. These quick controls make responding to an incident report nearly instant, and gets eyes on the scene right away.
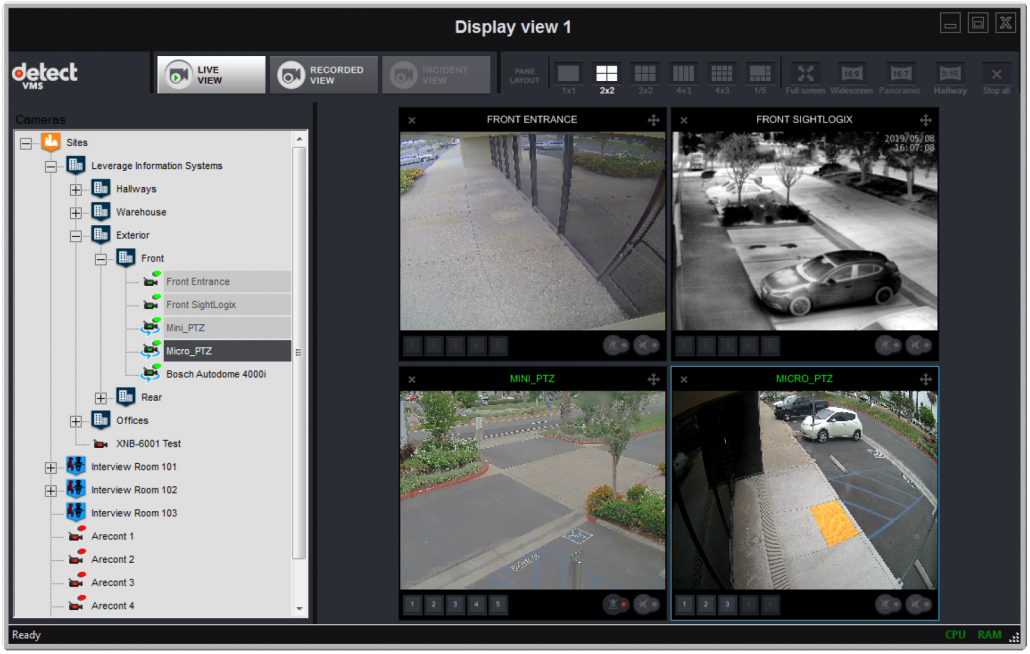
Detect Display View windows can show up to 12 video feeds at the same time.
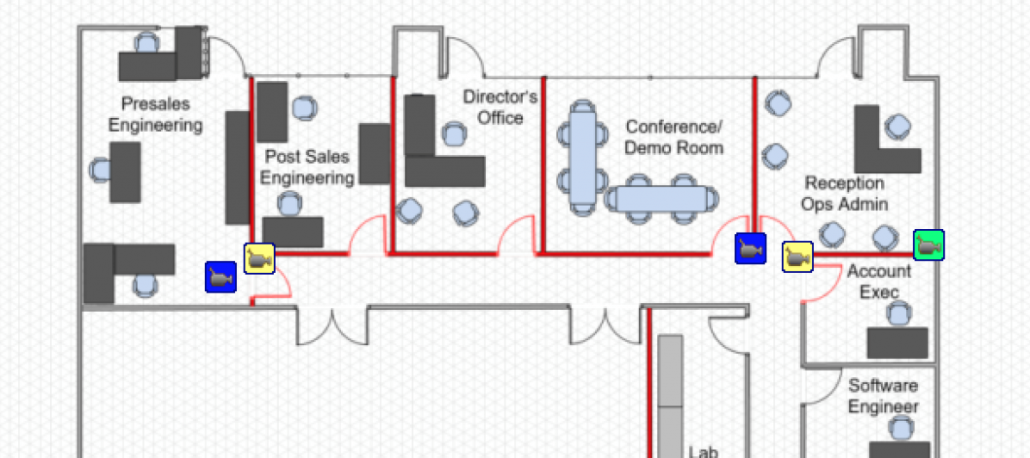
There is even a map component that allows you to see which assets are placed inside buildings.
Keeping the System Healthy
The other part of institutional knowledge is knowing the history of the whole system, which cameras are tricky or problematic, and staying on top of maintenance and repair. Leverage DETECT provides a number of ways to check on the performance of your system:
- Daily emails that show which cameras are online and which are down, so you can handle unexpected failures right away and share with others
- A Camera Recording Tracker is built directly into the Admin menu, for instant recording status updates
- Network Node View is a static documentation that displays every node and connection in the system on a map—including installation notes and photos—so you can pinpoint a point of failure and send a tech out with exact repair instructions.
Network nodes, connections, and speeds are all indicated in the Network Node View window.
And we’re working on even more system health tools that will roll out soon, with the goal of ensuring your system is up and recording with absolute transparency.
Knowing where your assets are, and whether they’re performing, is knowledge that should be available to anyone who needs it. The map component is a tool that puts the cameras into a spatial configuration that everyone understands, allowing for use, collaboration, and success with a minimum amount of training.